Four manuals, the U8903a Audio Analyzer Data Sheet, Quick Start Guide, User's Guide, and Programmer's Reference, were used in the preparation of this document (the preceding links are to local copies of the documents, you may want to check the Keysight website for more recent versions).
This software requires that the U8903A be connected to your computer via a USB cable before starting MATLAB.
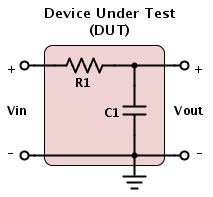
This document describes how to make measurements of the magnitude and phase response of a circuit or system, hereafter called the device under test, or DUT. The fundamental idea is that we would like input a sinusoidal signal to the input of a circuit (here the circuit is a simple RC circuit) and measure the amplitude and phase of the output voltage of the DUT relative to that of the input.
To perform this measurement we will use the U8903A Audio Analyzer. The U8903A is a powerful piece of equipment, but was not designed specifically to create Bode plots (magnitude and phase) of DUT's so we will need to do a little work to make the measurement. This document is not meant to be exhaustive, but to describe one way to make the specified measurement, and to give some idea how the U8903A works. After you feel comfortable with magnitude and phase measurements at a single frequency, you should feel free to experiment with different mesaurements.
The image below (from the Data Sheet) shows the front panel of the Audio Analyzer

The audio analyzer has two outputs (called "Generators" in the documentation) and two inputs (called "Analyzers" in the documentation).

For the purposes of this document we will only use the signal generators as sinusoidal sources used as the input for our DUT, and we will only need one channel (labeled "Channel 1" on the "Generator" portion of the front panel).
There are two fundamental options for measuring the magnitude of a signal at the "Analyzer" input channels. The first measurement type is an absolute magnitude (volts, or millivolts or dBV...); this can measure two voltages (Channels 1 and 2) simultaneously. The scond measurement is a relative measurement where the amplitude of one of the channels is measured realative to (or in reference to) the other channel; in this case we only get a single measurement of one of the channels, with the other channel acting as a reference. For example if channel 1 is 2 volts and channel 2 is 0.5 volts and channel 1 is the reference, then our measurement will be the quantity "4" since channel 2 (the measured channel) is 4 times channel 1 (the reference channel). Likewise, if channel 2 was the reference and channel 1 was the measured channel, the result would be "0.25"..
Since there is no absolute measurement for phase, all phase measurements are relative with one input channel being the measured channel while the other channel is the reference channel.
When we connect the audio analyzer to our DUT the resulting equivalent circuit is as shown below.
.png)
This diagram shows the generator output of the signal analyzer modeled as an ideal source, Vs, followed by an internal impedance, Rs (which can be programmed to be either 50Ω or 600Ω). However, the generator output at the external terminals of the audio analyzer is Vin. The internal resistance presents a difficulty: we can set the output of the generator (Vs) with accuracy, but because of Rs, we do not know Vin with accuracy, and we are trying to measure Vout relative to Vin.
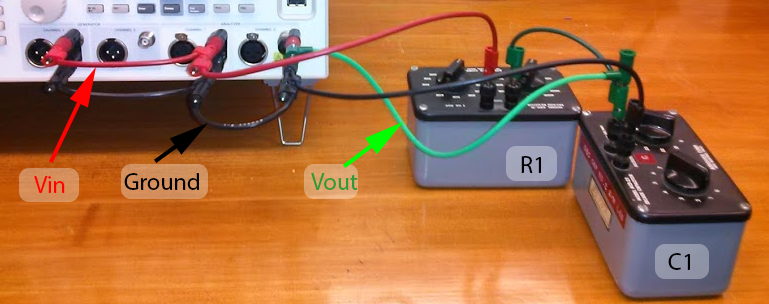
However, the difficulty is not hard to surmount. The output of the generator (we will use Channel 1) is Vin. We connect this to input (Analyzer) channel 1, and we connect Vout to input (Analyzer) channel 2. This is shown in a photograph below. (Alternate views 1, 2, 3).
Important: The U8903A Audio Analyzer must be turned on and connected by USB to the computer before MATLAB starts. MATLAB only scans for instruments at startup, so if you connect the instrument later, MATLAB will not find it.
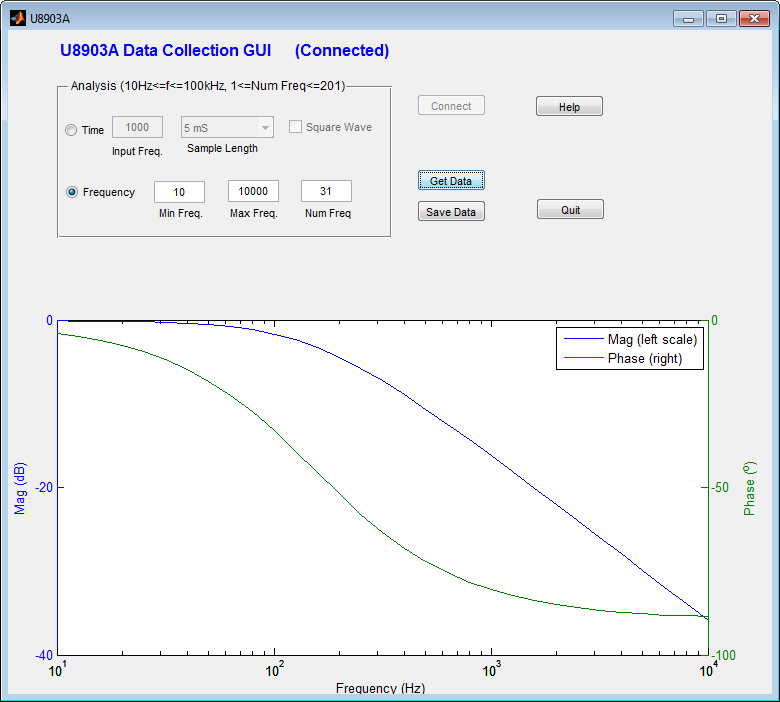
To quickly make measurements with the U8903A Audio Analyzer, you can use a MATLAB tool invoked by typing "U8903A" at the MATLAB prompt. This program should be available on all computers in Singer Hall. The initial screen should look something like that shown below.
If the software is not installed you can get it from https://github.com/echeever/U8903AGUI. You'll need to put both the U8903a.m file and the U8903A.fig files in your working MATLAB directory.

Hit the "Connect" button. The computer should connect to the Audio Analyzer. If not you will get an error message, and you will need to troubleshoot.
To make a frequency domain measurement (i.e., a Bode plot), select the "Frequency" radio button, select the start frequency, the stop frequency and the number of data points, then hit the "Get Data" button. The resulting screen will look something like the one below (the actual results will depond on the DUT). The magnitude and phase are shown on the same graph, with the scale for the magnitude plot on the left and that for the phase on the right.
Notes:
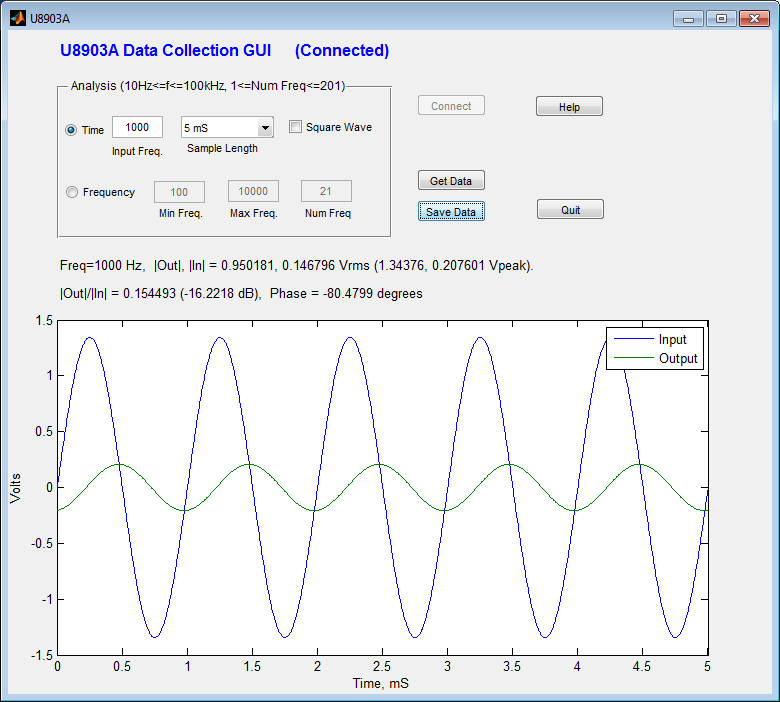
To make a measurement at a single frequency, choose "Time" as the Analysis type, the frequency of the input signal, the length of the acquisition, and make sure "Square Wave" is deselected. Hit "Get Data".
As before, the data can be saved. If you "load" the saved file, there will be seven variables:
To make a measurement with a square wave input, choose "Time" as the Analysis type, the frequency of the input signal, the length of the acquisition, and make sure "Square Wave" is selected. Hit "Get Data".
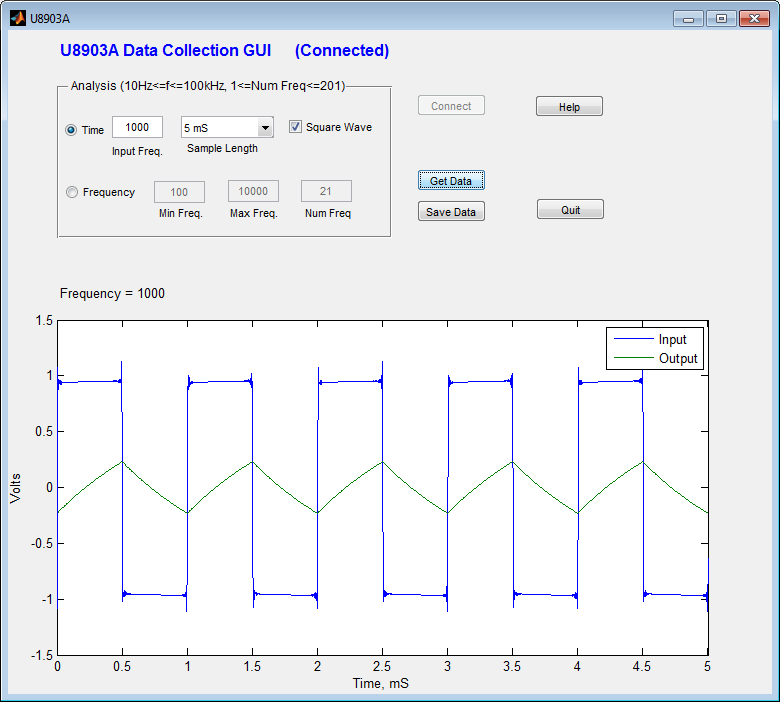
As before, the data can be saved. If you "load" the saved file, there will be four variables:
The next section of this document describes how to make a measurement of the magnitude and phase of Vout (Analyzer channel 2) relative to Vin (Analyzer channel 1). The text describes how to make the measurement using the buttons on the from panel of the U8903A. The following sequence of actions performs magnitude and phase measurements measurement at 200 Hz.
By selecting "Sweep" from the front panel (under "Mode") it is possible to choose a starting and ending frequency for a swept measurement. However, magnitude and phase can't be measured simultaneously for reasons described previously. The details of this measurement are left to the user to figure out, but it largely follows the ideas presented in the section on manual measurement
By selecting "Time" from the front panel (under "Mode") it is possible to do a time domain measurement for a variety of different signals (be sure to select both channels under "Monitor Settings"). The details of this measurement are left to the user to figure out, but it largely follows the ideas presented in the section on manual measurement
If you get an error connecting to the device make sure:
Please report any problems with, or suggestions for, this document to Erik Cheever (echeeve1@swarthmore.edu).